The Additive Colour System, and Why Satellite Images Look the Way They Do
How mixing red, green and blue light makes every colour on your screen, and how remote sensing uses the same idea to show things our eyes can't see.
Every colour on the screen you’re reading this on is made from just three lights: red, green and blue.
That sounds wrong at first. Where does yellow come from? Or white? But once you get how this works, a lot of things make sense, including why satellite images sometimes show forests as bright red.
Mixing light is not like mixing paint
At school we learn that mixing paints makes things darker. Mix enough colours and you get a muddy brown.
Light works the other way round. Every light you add makes things brighter. That’s why it’s called the additive colour system: you add light to get colour.
Imagine three torches, one red, one green and one blue, shining on a black wall:
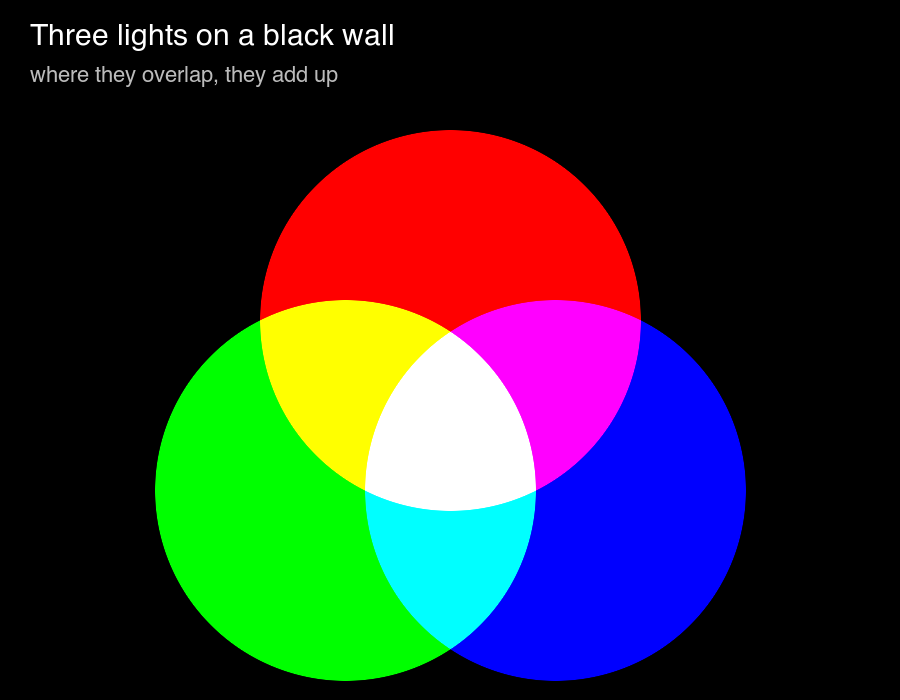 Where two lights overlap you get a new colour. Where all three overlap you get white.
That picture has all the rules in it:
- red + green = yellow
- green + blue = cyan
- red + blue = magenta
- red + green + blue = white
- no light at all = black
The yellow one surprises most people. In paint, red and green definitely don’t make yellow. With light, they do.
How your screen uses this
Zoom in really close on a phone or monitor and you’ll see that every pixel is actually three tiny lights: one red, one green, one blue. Each one can be turned up or down.
In a computer, the brightness of each light is stored as a number, usually from 0 (off) to 255 (full brightness). In remote sensing this number is called the DN, or digital number.
The colour you see is just whatever those three numbers add up to. Watch what happens as they change:
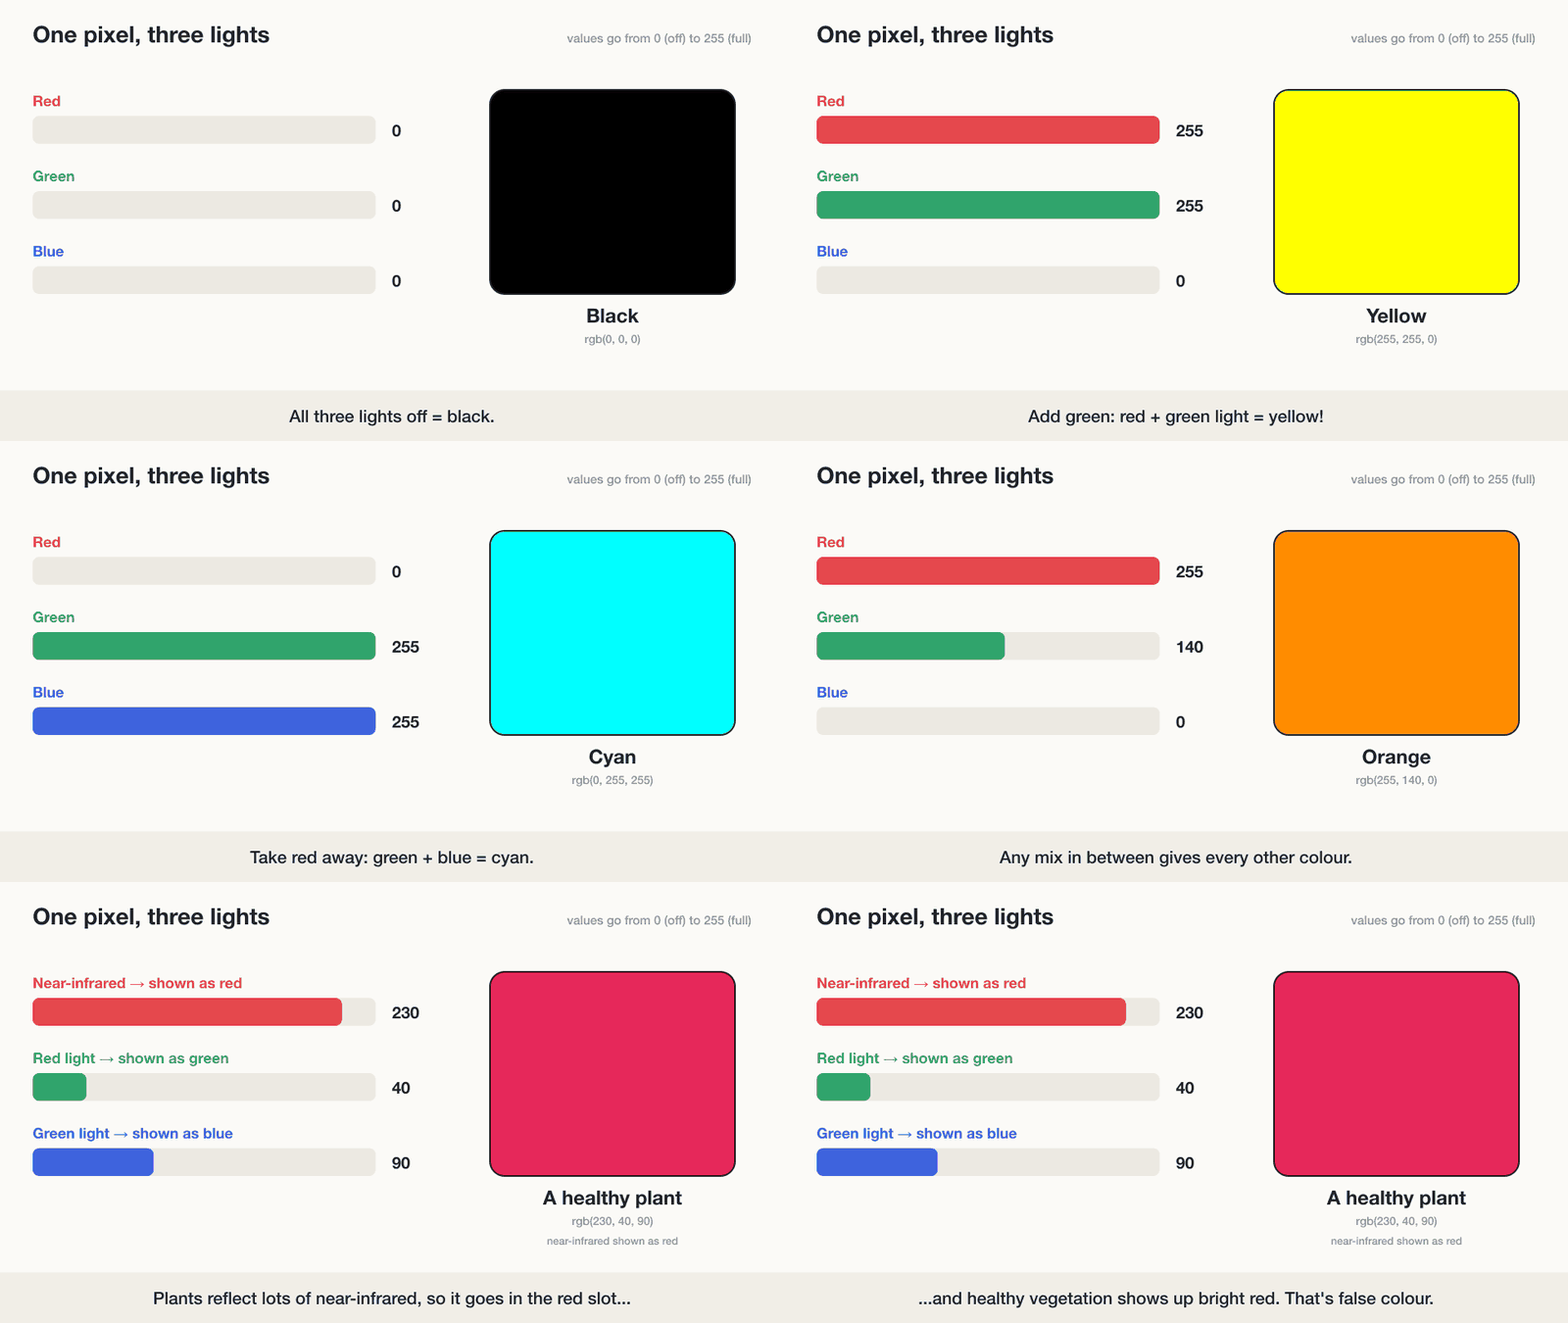 Three numbers per pixel, and that’s every colour you’ll ever see on a screen.
So a pixel stored as (255, 255, 0) shows up as yellow, (0, 0, 0) is black, and (255, 255, 255) is white.
Why this matters for satellite images
This is where it gets useful for GIS.
A camera on a satellite doesn’t take one colour photo. It takes several separate black-and-white images, each one measuring a different kind of light. These are called bands. One band for blue light, one for green, one for red, and often others for light that our eyes can’t see at all, like near-infrared.
On their own, each band is just a grey image. To get a colour picture, we pick three bands and put them into the screen’s red, green and blue slots.
Natural colour
If you put the red band in the red slot, green in green and blue in blue, you get a natural colour image. It looks roughly like what you’d see from a plane. Trees are green, water is blue, and so on.
False colour
But nobody says you have to put the bands in their “real” slots. You can put near-infrared in the red slot instead.
Healthy plants reflect a huge amount of near-infrared light. We can’t see it, but the satellite can. So when near-infrared goes into the red slot, every healthy plant suddenly shows up as bright red. That’s the last part of the animation above.
This is called a false colour image. It looks strange at first, but it’s incredibly useful:
- healthy crops and forests jump out in bright red
- stressed or dying plants look duller
- water looks very dark, because it absorbs near-infrared
- towns and bare soil show up in greys and browns
Different band combinations highlight different things. Some are better for water, some for soil, some for burnt areas after a fire. It’s all the same trick: choose which band goes into which colour slot.
In short
- Screens make colour by mixing red, green and blue light.
- Each pixel stores three numbers, one for each light.
- Adding light makes things brighter: red + green = yellow, all three = white.
- Satellite images are made of separate bands, and we choose which band goes in which colour slot.
- Putting near-infrared in the red slot makes healthy vegetation glow red. That’s false colour, and it’s one of the most useful tricks in remote sensing.
Next time you see a bright red satellite image of a forest, you’ll know nothing’s wrong with it. It’s just showing you light you can’t normally see.