Why Glance Became My Daily Self-Hosting Dashboard
How Glance turned a pile of browser tabs into one page that shows my whole self-hosted setup.
When you self-host a few services, you end up with a lot of tabs. One for each app, one for backups, one to check which devices are online, one for GitHub… and every morning you click through all of them just to make sure nothing’s broken.
Glance fixed that for me. It’s a self-hosted dashboard: a single page where you put little boxes (called widgets) for all the things you want to keep an eye on. I open it, look for a few seconds, and I know whether everything’s fine.
What it looks like
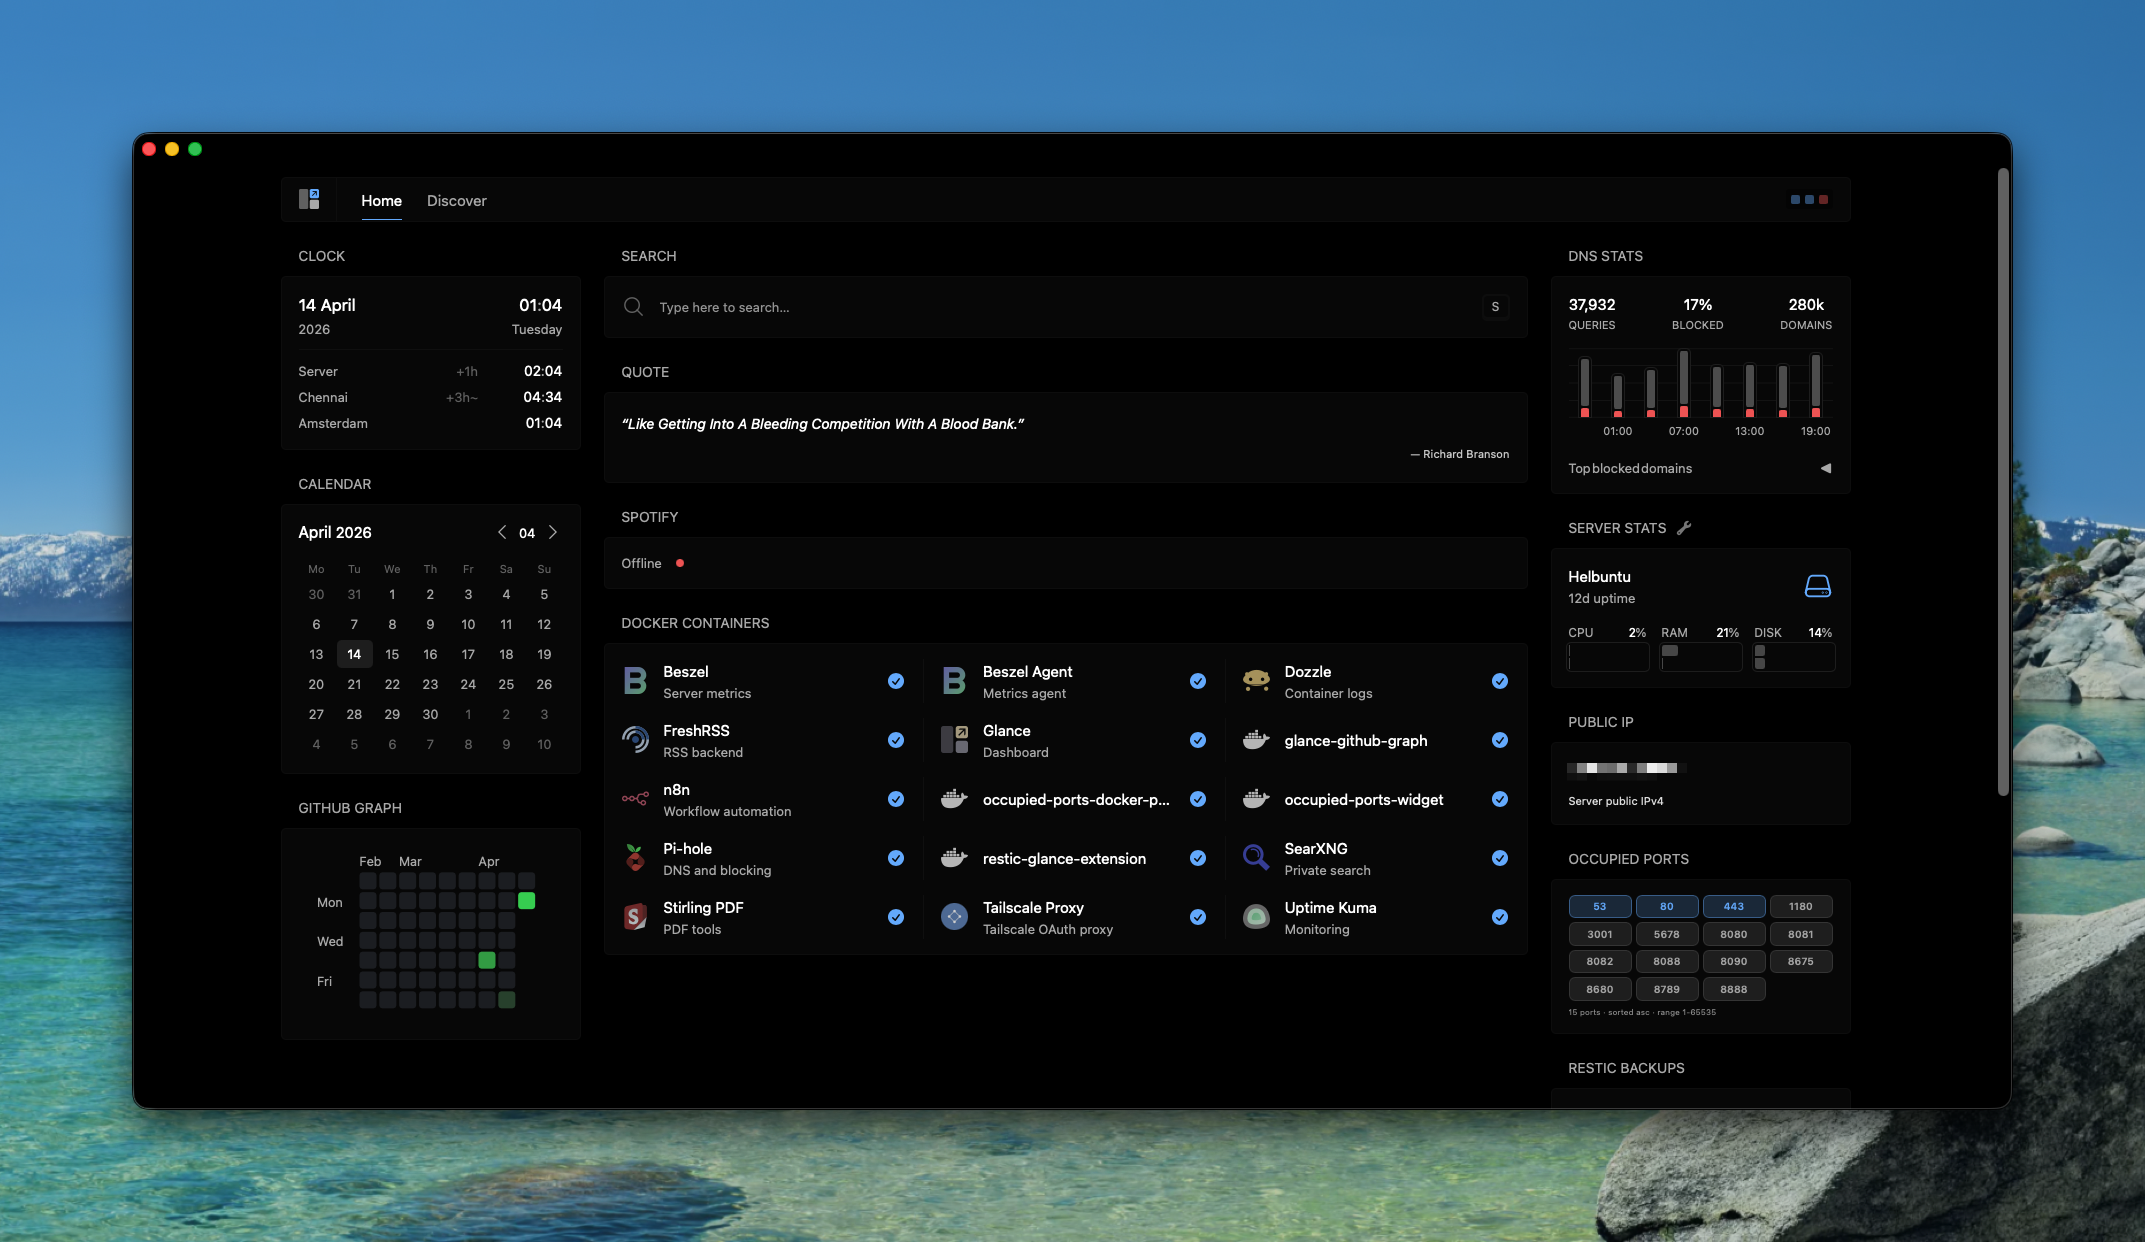
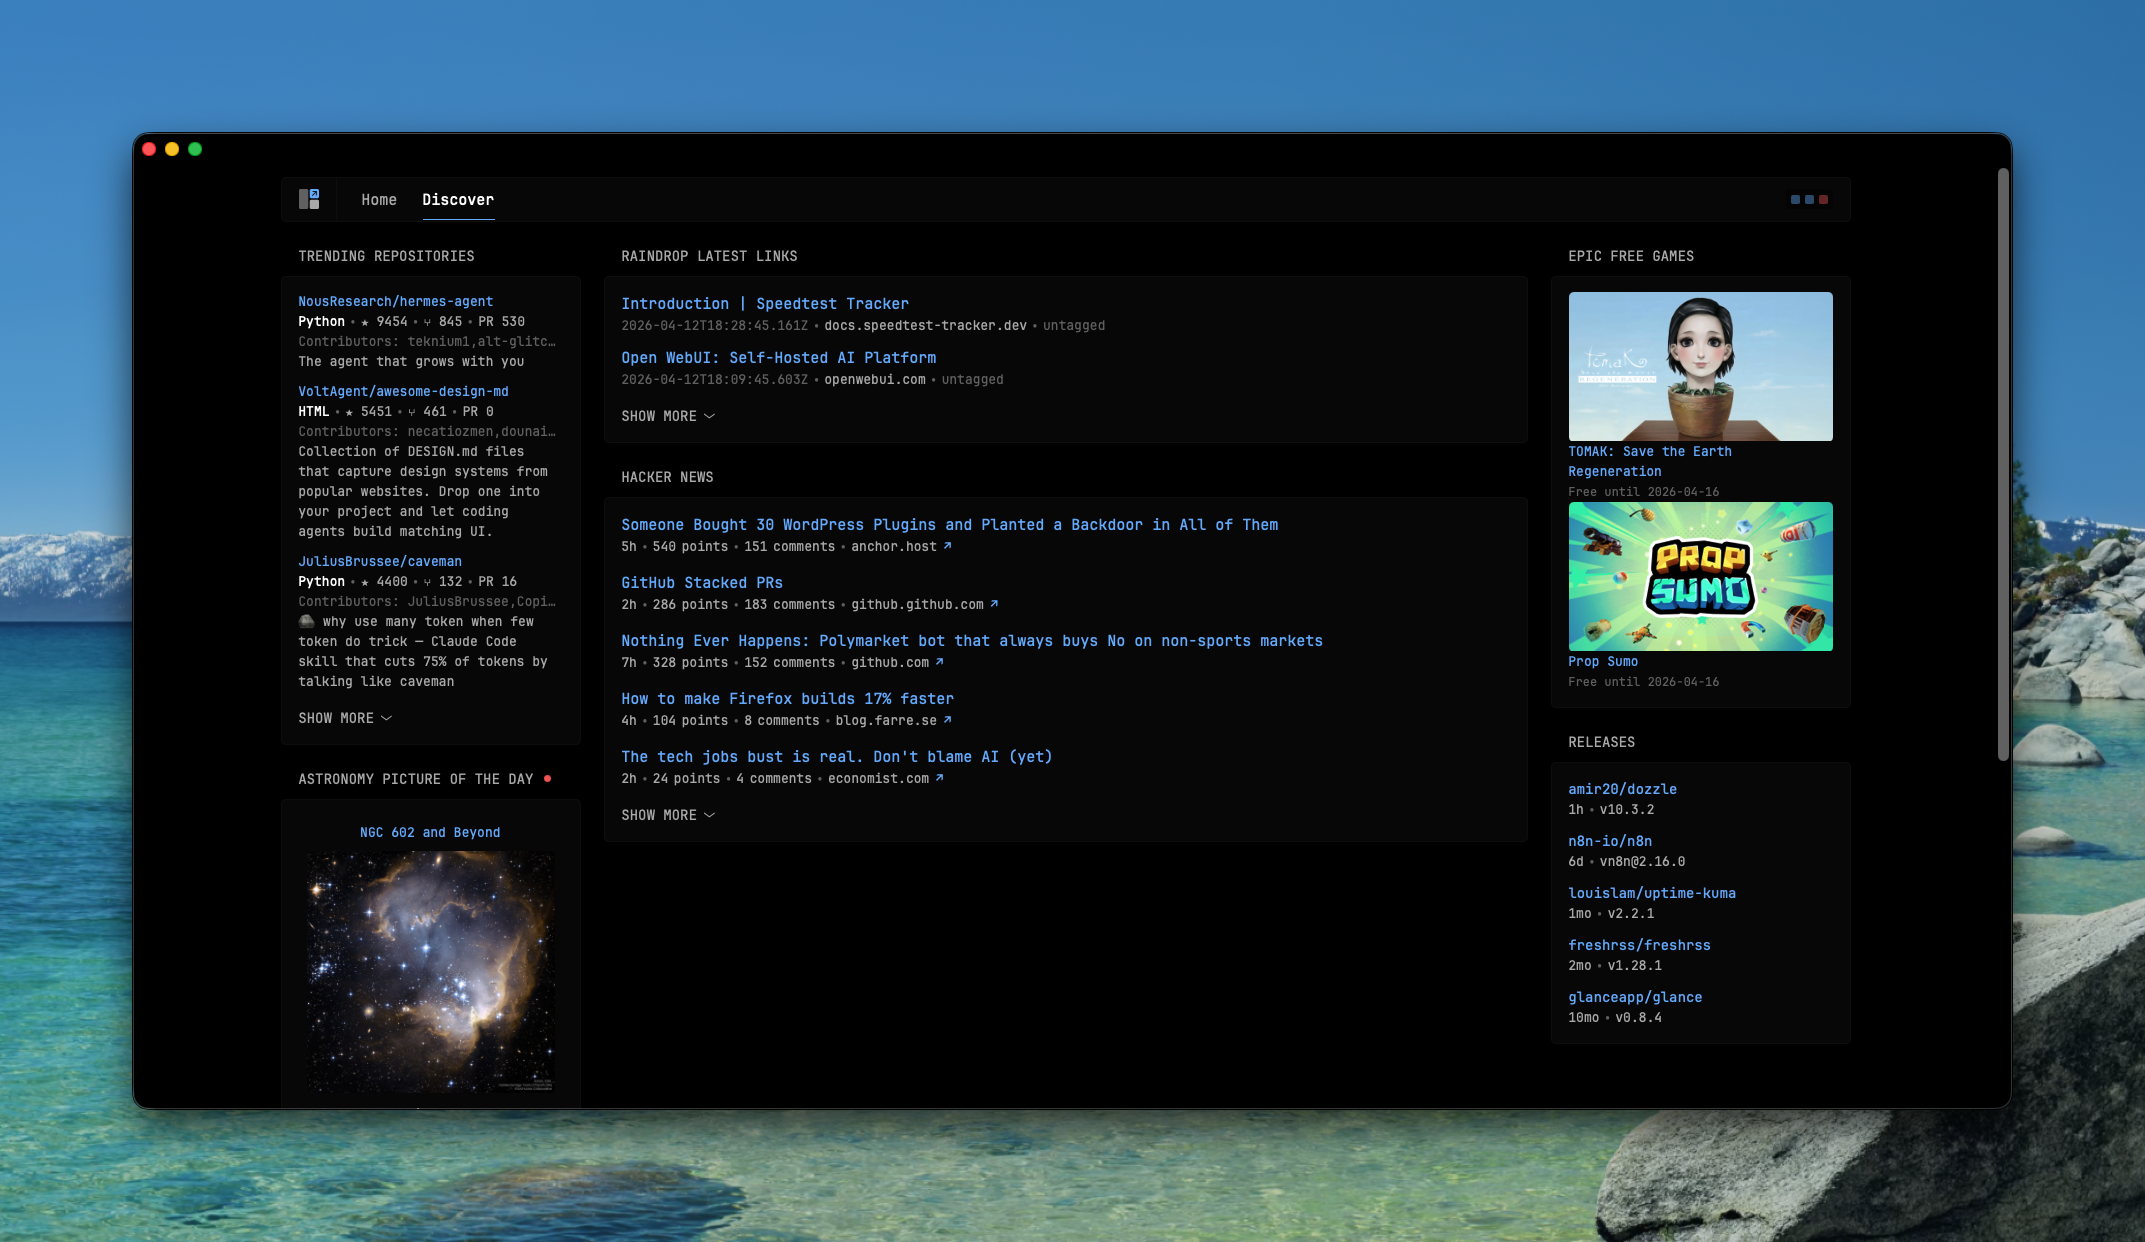
Here’s my setup right now:
The widgets I use
Some of these come with Glance, some are extensions, and one I built myself:
- Clock with a few time zones. The server’s time and the ones I care about.
- Calendar, for a quick look at the week.
- Search with custom shortcuts (bangs), including my own SearXNG instance.
- Spotify now playing. Not useful at all, but I like it.
- GitHub contribution graph, to see my activity.
- Tailscale devices, so I can see which of my machines are online.
- Restic backup status. Probably the most important one. Backups you never check are backups you don’t really have.
- Occupied ports, a widget I made to avoid port clashes when deploying something new. I wrote about it here.
- A daily quote, just for fun.
Why it stuck
I’ve tried a few dashboards before. Most of them looked great in screenshots and then felt like extra work to maintain. Glance is different for a few reasons.
It’s light. Even with all of these widgets the page loads fast, and it doesn’t eat much memory on the server.
It’s just one config file. The whole dashboard lives in a YAML file. Adding a widget means adding a few lines and refreshing. No clicking through settings menus.
It can show almost anything. Besides the built-in widgets, you can point it at any API and decide how the result should look. That’s how I built my ports widget without having to change Glance itself.
It’s useful while I work, not just to look at. When I’m deploying or debugging something, I keep it open in a tab. Backups, devices and ports are all right there, so I don’t have to go and check.
Links
- Glance: github.com/glanceapp/glance
- My Occupied Ports widget: github.com/js-surya/occupied-ports-widget
Big thanks to the Glance maintainers and contributors for building something this clean and practical, and keeping it free for everyone.
If you’re starting a homelab, I’d set up a dashboard early. It sounds like decoration, but it’s the thing that tells you when something quietly stopped working.